

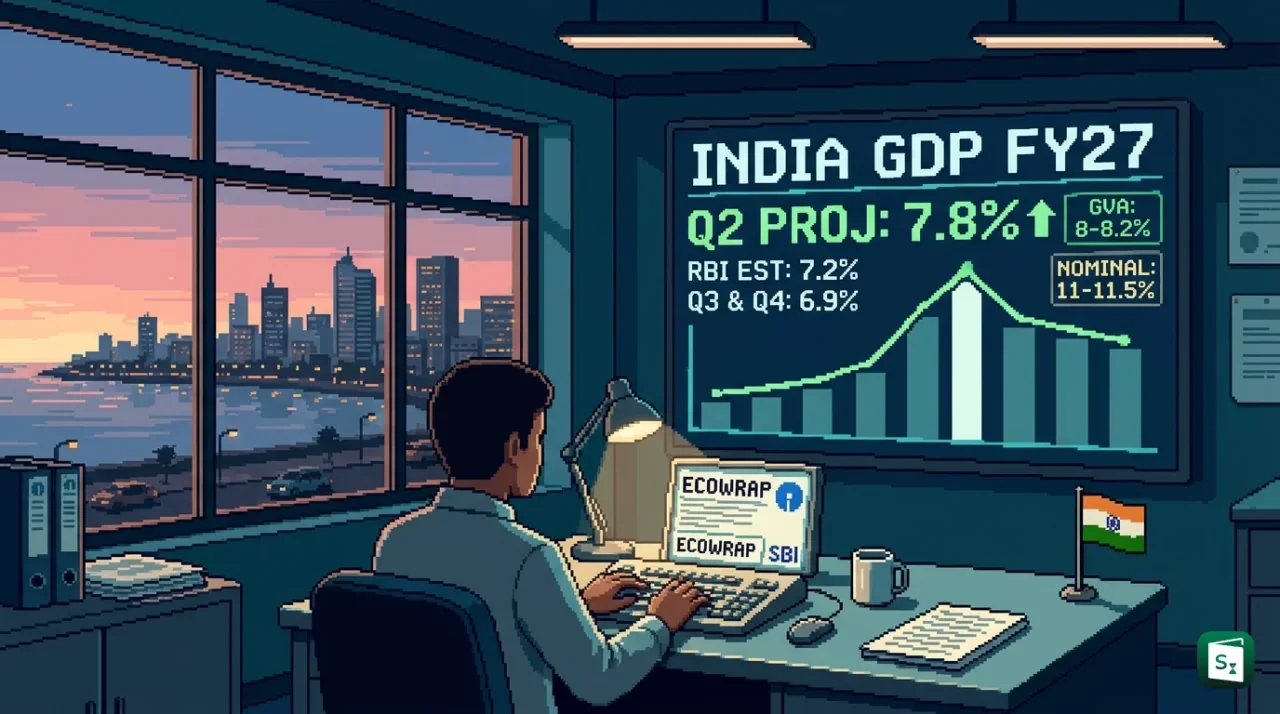
The Economic Research Department of the State Bank of India has projected India GDP growth at 7.8% for the second quarter of FY27 covering July to September 2026. The SBI Ecowrap estimate is 60 basis points higher than the Reserve Bank of India forecast of 7.2% for the same quarter. SBI also expects growth to ease to 6.9% in the third and fourth quarters, with official data due on 30 November 2026.
What Is GDP and How Is It Measured in India?
Gross Domestic Product (GDP) is the total market value of all final goods and services produced within India during a specific period. The National Statistical Office (NSO) under the Ministry of Statistics and Programme Implementation (MoSPI) compiles the estimates and releases quarterly and annual data. In India, GDP at market prices is derived by adding product taxes and subtracting product subsidies from the total Gross Value Added (GVA).
Real GDP measures output at constant prices after removing the effect of price rises, while nominal GDP measures output at current prices including inflation. The gap between the two is captured by the GDP deflator, which is the ratio of nominal GDP to real GDP multiplied by 100. A related idea is the GDP base year, the reference year whose prices are used to calculate real growth.
| Concept | What It Shows | Example From Q2 FY27 Context |
|---|---|---|
| Real GDP | Change in actual output volume | SBI projects 7.8% growth |
| Nominal GDP | Output value at current prices | SBI projects 11 to 11.5% growth |
| GVA | Value added by producers before product taxes and subsidies | SBI projects 8 to 8.2% growth |
| GDP deflator | Broad price change for the whole economy | SBI estimates 3.4% for GDP, 4.1% for GVA |
Why SBI Expects 7.8% Growth in Q2 FY27
The SBI Ecowrap report bases its Q2 FY27 projection on a Dynamic Factor Model that tracks 54 high frequency indicators across agriculture, industry and services. The model converts monthly signals like production, sales, freight, credit and exports into a single growth reading. SBI Research, led by Group Chief Economic Adviser Soumya Kanti Ghosh, said the model points to real GDP growth of about 7.8% for July to September 2026.
Business activity stayed broad based during the quarter. SBI found that about 88% of 50 leading indicators showed acceleration in Q2 FY27, up from 86% in the previous quarter. Manufacturing growth is estimated at 8.7% in real terms, while services growth is estimated at 9.7%. Cement output, commercial vehicle sales, non-oil exports and port cargo gained pace toward the end of the quarter, even as mining, tractor sales and air passenger traffic softened.
Corporate results support the estimate. SBI studied about 2,300 listed companies outside banking, financial services and insurance. Their earnings before interest, taxes, depreciation and amortisation rose 35% from a year ago, while profit after tax rose 33%. Bank credit also stayed strong. Scheduled commercial banks recorded 18.2% credit growth for the fortnight ended 15 October, with deposits up 16.7%. Public sector banks reported better asset quality than private banks.
The SBI forecast matches the 7.8% growth recorded in Q1 FY27 and sits above outside estimates. The Reserve Bank of India (RBI) projected 7.2% for Q2 in its October 2026 monetary policy review, which is 60 basis points lower. One basis point equals one-hundredth of a percentage point, so 60 basis points mean 0.60 percentage points. Bank of America Global Research raised its Q2 estimate to 7.7%, close to the SBI reading.
How Do GDP, GVA and Nominal Growth Differ in Q2?
The SBI Ecowrap report projects GVA growth of 8 to 8.2% in Q2 FY27 and nominal GDP growth of 11 to 11.5%. GVA measures output minus intermediate consumption and shows what producers have added in farms, factories and service firms. GDP equals the sum of GVA plus product taxes minus product subsidies. Nominal GDP adds price changes to real growth, so it is normally higher when prices rise.
Price pressures explain much of the gap between the three numbers. SBI estimates the GVA deflator at 4.1% and the GDP deflator at 3.4% for the quarter. The agriculture deflator rose sharply to 6.4%, reflecting higher farm output prices. The services deflator stood at 3.5%. The manufacturing GDP deflator remained negative, which means real manufacturing growth was higher than nominal manufacturing growth.
The negative manufacturing deflator comes from the new double deflation method. Under this method, the NSO deflates output and inputs separately using detailed price indices. In Q2, input prices rose faster than output prices in many industries. When input costs are removed, the remaining real value added can grow faster than its current price value. The result is a negative implicit deflator even though both input and output prices increased.
SBI also pointed to weak pass through of costs. Input prices stayed above output prices in electrical equipment, computers, electronic and optical products, furniture and fabricated metal products. Producers absorbed part of higher costs instead of raising selling prices fully. Net indirect taxes after subsidies are estimated to grow only 5.3% in the quarter. Excise duty collections fell 22%, while subsidy spending grew faster, which pulled GDP growth below GVA growth.
What Explains the Slowdown to 6.9% in the Second Half of FY27
The SBI Ecowrap report expects real GDP growth to moderate to 6.9% in both the third and fourth quarters of FY27. The slowdown partly reflects a high base after two quarters of 7.8% growth and rising risks to farm output. Agriculture and allied activities are estimated to ease to 2.8% in Q2 from 3.6% in Q1, as average farm output prices rose 7.8% during July to September compared with 4.95% in the previous quarter.
Weather is the main risk. SBI said the effect of El Nino, a warming of Pacific waters that often weakens the Indian monsoon, has shifted from the Kharif season to the Rabi season. The government expects farm production to fall 11.4% this year. SBI estimates total production loss of about 3.86 crore tonnes across both seasons, with 0.89 crore tonnes in Kharif and 2.97 crore tonnes in Rabi. Kharif losses are concentrated in Rajasthan, Punjab, Uttar Pradesh and Maharashtra, while Rabi risks are higher in Madhya Pradesh, Uttar Pradesh and West Bengal.
The RBI shares the view that momentum will cool. In its October 2026 policy, the RBI projected full year FY27 growth at 7.1%, with Q2 at 7.2%, Q3 at 6.9% and Q4 at 6.8%. It cited deficient monsoon, strong El Nino conditions, volatile crude prices and West Asia tensions. The central bank still expects urban demand to hold up on services strength and stable jobs, with infrastructure spending, healthy credit flow and trade deals supporting investment. SBI estimates the direct hit to credit from El Nino at only about 2.8% because of foodgrain buffers and policy support.
Why the New GDP Base Year Matters for Comparisons
The MoSPI released a new GDP series with base year 2022-23 on 27 February 2026, replacing the 2011-12 series. The base year supplies the reference prices for real growth and is updated about every five years to capture structural change. The year 2022-23 was chosen because it was the first normal year after Covid, with full data on production, consumption and taxes.
The new series uses wider data and better methods. It draws on Goods and Services Tax (GST) records, the Ministry of Corporate Affairs (MCA) database, the Public Finance Management System, E-Vahan vehicle data, the Annual Survey of Unincorporated Sector Enterprises and the Periodic Labour Force Survey. It applies double deflation in manufacturing and agriculture and single extrapolation elsewhere, with more granular price indices. A Supply Use Table framework now reduces the gap between production and spending based estimates.
SBI warned against mixing the two series. Q1 FY27 under the new base showed real GDP of 81.36 lakh crore rupees with 7.8% growth and nominal GDP of 88.27 lakh crore rupees with 10.3% growth. For Q2, SBI projects nominal GDP of 88.9 lakh crore rupees on a like for like new series basis. A comparison of Q2 FY27 new series output with Q2 FY26 old series output would show only 4.3% nominal growth because the old base value was 85.3 lakh crore rupees. The correct like for like comparison gives 11 to 11.5%, which reflects true price and volume change.
Key Takeaways
- SBI Ecowrap projected India GDP growth at 7.8% in Q2 FY27, which is 60 basis points above the RBI forecast of 7.2%.
- SBI expects GVA growth of 8 to 8.2% and nominal GDP growth of 11 to 11.5% in Q2 FY27.
- SBI projects real GDP growth of 6.9% in both Q3 and Q4 FY27, while RBI projects 7.1% for full FY27.
- SBI estimated the GDP deflator at 3.4% and GVA deflator at 4.1%, with agriculture at 6.4% and services at 3.5%.
- India shifted its GDP base year from 2011-12 to 2022-23 on 27 February 2026, with official Q2 data due on 30 November 2026.